More export options
In addition to exporting statistics and analysis results in a text and spreadsheet format, you can now also use a semicolon-separated format. This makes the export option more flexible.
All statistics and analysis results can be exported to text documents or spreadsheets for further processing. This is done by clicking on the export button that appears when you hold the mouse pointer over the statistics in question.
You are presented with various options related to the export format and how decimals should be processed:
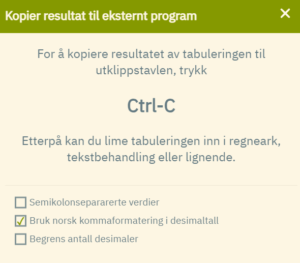
If you are using a Norwegian version of Excel or Google Sheets, it is recommended that you tick “Bruk norsk kommaformatering i desimaltall” (“Use Norwegian comma formatting in decimal numbers”). Decimal numbers are then correctly represented when you paste into a spreadsheet. Then use the key combination ctlr + c to export, and paste in the usual way (ctrl + v) into a text document or spreadsheet (Google Sheets works best).
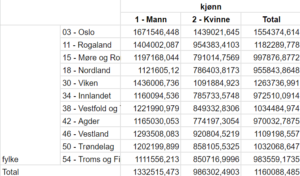
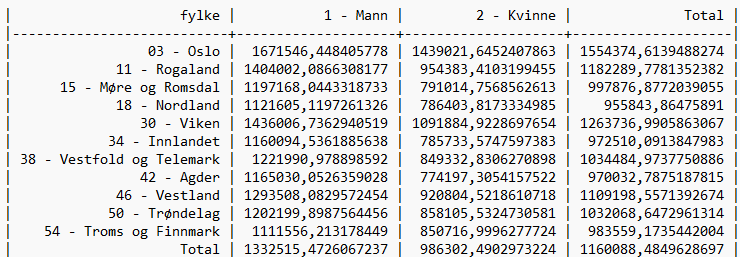
If you use standard format, cf. illustration above, the result is typically like this in Google Sheets and text documents (note that you get access to all decimal places when exporting):
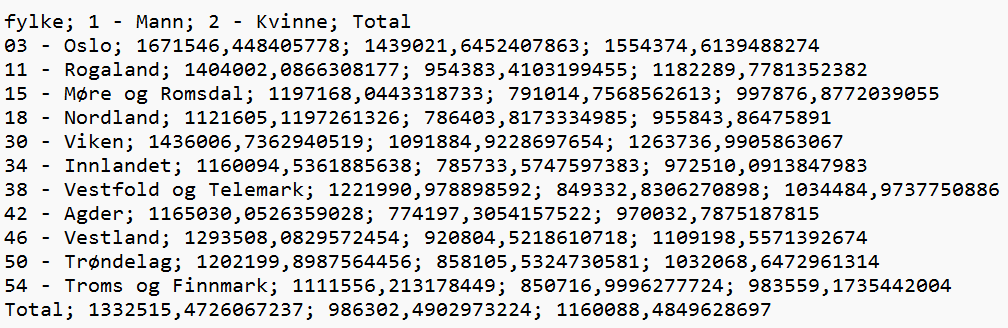
If you use the option for semicolon separated values, it will look like this in a text document:
Tip 1: If you are creating a complex table, it may be a good idea to use the tabulate option flatten. This ensures that the format of the exported table is flattened as much as possible, so that merged cells are avoided to the greatest extent possible when exporting to spreadsheets.
Tip 2: It is possible to export all the results you have generated in one operation. Then you don’t have to do this for each table. You then use this option: